Learn » Blog » Small fees, big impacts: how fees can affect your long-term investment balance
Small fees, big impacts: How fees can affect your long-term investments
Published on 03/12/2024

Editor’s note (updated 1 September 2025): Since this blog was published, Simplicity has reduced its investment management fee for diversified KiwiSaver and Investment Funds from 0.25% to 0.24% p.a.
Familiar with the old saying: "There's no such thing as a free ride”? This certainly applies when it comes to investing. When you decide to invest in KiwiSaver, a managed fund, or individual shares, you're certain to encounter fees of some type. While they may appear insignificant, fees can really add up, significantly affecting your overall investment returns over time. Here, knowledge is power - understanding how fees function and their potential long-term impacts, will allow you to optimise your personal investing choices.
Types of investment fees
Investment providers charge a range of different fees on their products, generally intended to cover costs as well as allowing them to make a profit. KiwiSaver and managed funds usually charge annual management fees, which represent a percentage of your total investment. For instance, a 1% management fee means the fund will deduct 1% of your total investment balance each year. Funds may charge additional fees such as entry and exit fees, membership fees, performance fees or adviser fees.
Usually, fees are deducted from your returns or balance automatically, or impact the unit price within the fund. So it may be easy to forget that you’re actually paying them - unlike your power or phone bill. While fees vary in type, how they’re charged and amount, investment fund providers must disclose them in their Product Disclosure Statement, and specify them in the annual statements provided to investors.
Active vs passive fund management fees
Management fees can vary widely across providers and funds. Passive funds, which follow an index, typically charge lower fees. Simplicity, for example, has single-sector index funds that charge between 0.10% and 0.15%. Two of InvestNow’s Vanguard-based index funds charge an even lower 0.03% annual management fee, but add a 0.50% transaction fee on buying and selling. Actively managed funds tend to have higher expenses than their passive counterparts. Since their managers are actively trying to outperform given benchmarks, they usually charge higher fees to cover additional costs associated with evaluating and selecting investments.
Actively managed funds commonly charge management fees of 1% or higher, depending on the investment mix and fund type. But how do we find the fees…? Most major managed funds readily publish their fees on their websites. This information must also be available in the Product Disclosure Statement (PDS), which will be available on the company's website. If you’re investing via a third party platform like Sharesies, Hatch or InvestNow, you should also be able to find what the fees are within that platform.
An example of the impact of fees
Let's illustrate the impact of fees over 25 years, with a (fictional) example. Imagine you and a friend each had $10,000 to invest. Both of you opted to invest this lump sum into funds that both happened to have consistent annual returns of 6.0% (before fees) over 25 years. However, you chose a fund with a 0.25% annual management fee, while your friend’s choice charged 1.48%. Not a big difference, right?!
Let’s review the impact of these fees over 25 years, keeping in mind this example is very simplistic and doesn’t take into consideration any tax, market conditions, varying annual performance, withdrawals, or other fees that could be charged or changed. Assuming identical performance year on year, your investment would've grown over the 25 years to about $40,400 (or around $24,600 in today’s dollars). In contrast, your friend's investment would've reached about $29,900 - or $18, 200 when inflation adjusted. That's a difference of $10,500 in 25 years, which, at 2% inflation, equates to over $6,400 in today’s money. This difference demonstrates the compounding effect that higher fees can exert over time.**
Looking at the (even longer) long term impact
To really understand how much fees can impact your investments, it's worth taking an even longer term view - like you typically would in KiwiSaver. Given the complexity and impact of income levels, employer and government contributions on KiwiSaver funds, let’s imagine another investment fund calculation. We’ll go with a typical growth type fund example. According to Sorted’s Smart Investor Tool, the average growth fund returns over five years as at 19 April 2024 was 6.02% after fees and tax. However, to remain consistent and provide a super conservative estimate here, we will again go with the 6% before-fees return.
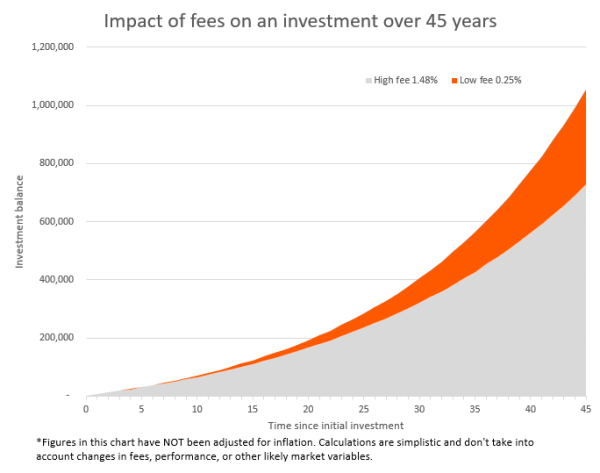
Let’s say a 20-year old investor began with $1,000 in this imaginary growth fund and contributed $5,000 at the start of each year (equivalent to just under $100 a week) over their 45-year career. We’ll use that annual 1.48% management fee again, and assume the 6% (before-fee) average returns persisted throughout this period. While seemingly small, over 45 years the 1.48% fee would add up to over $170,000 deducted from their account and their final balance would reach around $728,000, equating to over $298,000 in today’s dollars (i.e adjusting for inflation). However, a lower 0.25% fee over the 45 years would add up to $38,000 of fees paid, leading to a final investment balance of around $1.05 million - which is around $433,000 in today’s dollars. Adjusting for inflation in both cases, that’s a difference of almost $135,000 to spend in retirement!**
Figure 1: Investment balance over 45 years comparing a 1.48% fee to a 0.25% fee

Assessing your investment options
You can compare a range of investment options available in NZ by visiting Sorted’s Smart Investor Tool and filtering by your preferences. It will spit out a list of available funds. Results are sortable by fund type, past returns, and fees, facilitating a straightforward comparison with your current fund if you’re already investing. Of course, fees aren't the only consideration when making investment decisions - they're just one piece of the puzzle. Other factors to consider include historical performance, customer service, investment strategies, environmental, social, and governance (ESG) criteria, technology, and the people behind the fund.
You don’t necessarily get what you pay for
Many will argue that what truly matters is an investment's after-fee returns. And while high fees charged by actively managed funds may be justified if they outperform comparable indexes on an after-fee basis, historical data suggests this is uncommon over the long-term. According to S&P Global's SPIVA reports, the performance of actively managed funds often lags behind that of their benchmarks. For instance, over the past decade to 31 December 2023, 87.42% of large-cap active funds underperformed the S&P 500 index*.
Figure 2: Percentage of Large-Cap US Equity Funds underperforming the S&P 500 each year, according to S&P Global’s annual SPIVA studies
There are plenty of things investors can’t control - market trends, inflation, individual business decisions, Central Bank policy and more. But one thing you can control is the amount you pay in fees. Higher fees don't necessarily translate into better after-fee returns; in fact the global research points to the opposite.
The information provided and opinions expressed in this post are intended for general guidance only and not personalised to you. These materials do not take into account your particular financial situation or goals and are not financial advice or a recommendation. This post is not intended to convey any guarantees as to the future performance of any of the investment products, asset classes, or capital markets mentioned. Past performance is no guarantee of future performance. Information is current at the time of posting, and subject to change without notice. Simplicity NZ Ltd is the issuer of the Simplicity KiwiSaver Scheme and Investment Funds. For Product Disclosure Statements please visit our website simplicity.kiwi
*The SPIVA Institutional Scorecard results showed that 87.42% of All Large-Cap funds underperformed the S&P 500 over the 10 years to December 31, 2023. For the latest SPIVA Scorecard results for markets around the world, go to https://www.spglobal.com/spdji/en/research-insights/spiva/.
**The two examples are simplified and don’t factor in any market conditions, contribution rates, changing fund choice, other fees, or the variability in the fund manager’s performance. Graph provided does not show inflation-adjusted investment balances, which are included in the written example for reference.


